Understanding DISC Personality Test, DISC Profile Type Intensity
Are You a High D, I, S or C?
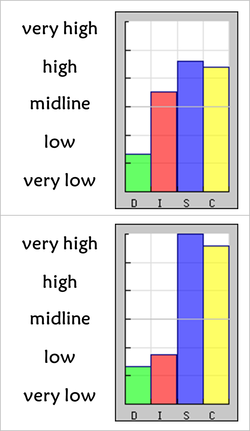
 This is an important part of interpreting the DISC Test. The graphs to the left represent the Basic Styles (Graph II) of two different people. Note the following features:
1. Trait Intensity – Intensity has to do with how high or low the scores are along the four types. The intensity is measured by the scale – very high, high, low, and very low. The midline is the base for determining high/low. Some “max out” a scale, others are mid-range, and others are barely above mid-line. DISC Assessment results are often described as “High I” or “High S,” etc., which means one’s graph appears above the midline on those types. Intensity matters, as different qualities characterize each zone.
2. Primary Trait – The highest score above the midline is your primary trait or driving force. For example, the top graph to the right reveals a “high” S primary trait, and the bottom graph reveals a “very high” S. This means most often both people will manifest “S” behaviors, but that the first will be less intense than the second.
3. Secondary Trait – When more than one type appears above the midline, but still lower than the primary trait, they are secondary traits. Secondary traits, although strong, usually express themselves in ways that support the primary trait. For example, both graphs have multiple types above the midline. The top graph is a “S primary and C/I secondary,” or “High S/C/I.” This person will be very supportive of others (S) particularly in offering others consistent, quality outcomes (C), and if the environment is pleasant, will add fun and variety to the situation (I). The bottom graph is a “S primary/C secondary,” or “Very High S/C.” Notice the much higher intensity on both of these traits compared to the one at the top. This person will be very supportive, sensitive, kind, and soft-spoken (S) and serve others with their high attention to quality, accuracy, and detail (C). Notice, however, the much lower scores on the I scale than in the top graph. This means the person in the second graph is likely to be more reserved and less outgoing.
4. Low Trait – Low traits are those below the midline, but they still factor into one’s type. For example, notice that D is low in each sample graph, which means it is unrealistic to expect dominant, directive behaviors from either of these people.
The next article in this explanatory series describes the difference between the DISC Profile and another popular personality test, the Myers-Briggs Type Indicator.


